| Oracle® Database 2 Day DBA 11g Release 1 (11.1) Part Number B28301-01 |
|
|
View PDF |
| Oracle® Database 2 Day DBA 11g Release 1 (11.1) Part Number B28301-01 |
|
|
View PDF |
At times, database performance problems arise that require your diagnosis and correction. In most cases, these problems are brought to your attention by the Automatic Database Diagnostic Monitor (ADDM), which does a top-down system analysis every hour by default and reports its top findings on the Database Home page.
This section contains the following topics:
ADDM output consists of a description of each finding and a recommended action. You can view a summary of findings and their impacts on the system.
To view a summary of ADDM performance findings:
Go to the Database Home page.
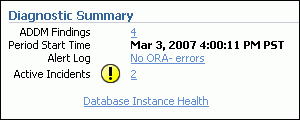
In the Diagnostic Summary section of the Database Home page, locate the numeric link next to the ADDM Findings label.

The number indicates the number of findings from the most recent ADDM run. If this number is zero, there are no ADDM findings to investigate.
If this number is not zero, continue to Step 3.
View the ADDM Performance Analysis section, below the Alerts section of the Database Home page.

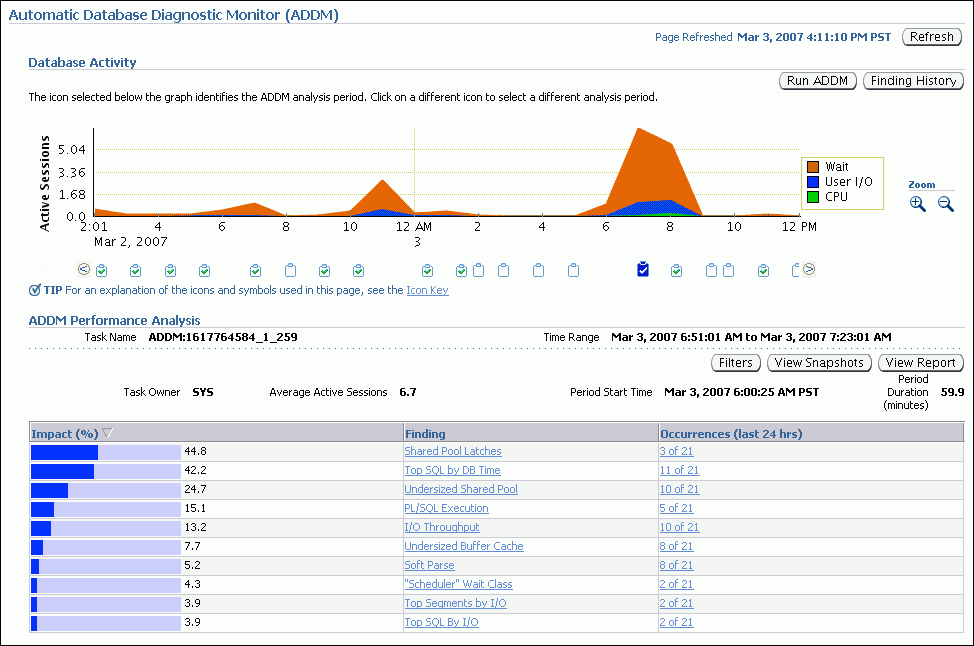
This section is present only if there are ADDM findings. It displays the first five findings from the most recent ADDM run. If there are more than five findings, controls appear to enable you to view the next five findings, and so on.
In the Diagnostic Summary section of the Database Home page, locate the nonzero numeric link next to the ADDM Findings label, and click it.
The ADDM page appears, showing a summary of all findings from the most recent run, and a graphical timeline showing session activity over the past 24 hours.

Click Help for more information about this page.
Each clipboard icon beneath the graph represents a time range within the 24 hours. Click an icon to view findings for the ADDM run that took place during that icon's time range. If more than one ADDM run occurred during that time range, you can select an individual ADDM run from the list that appears next to the Task Name label.
You can act upon the recommendations that accompany ADDM performance findings.
To respond to ADDM performance findings:
In the ADDM Performance Analysis section of either the Database Home page or the ADDM page, in the Finding column, click a finding.
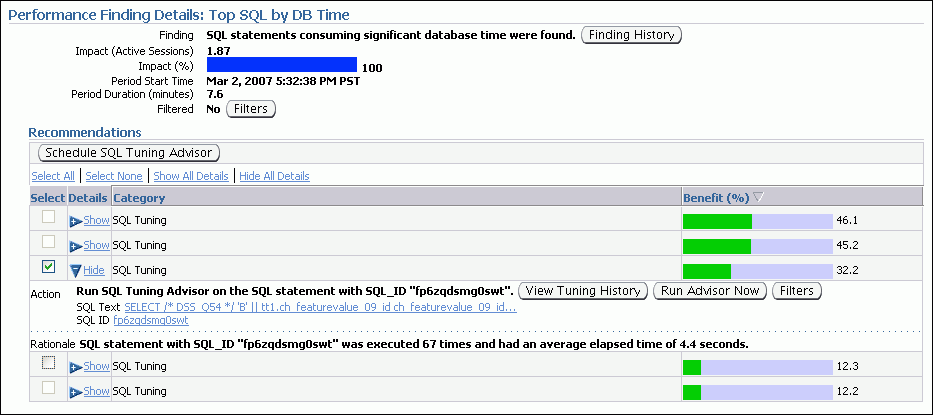
The Performance Finding Details page appears.

In the Recommendations section, click Show All Details.
Choose a finding to respond to, and follow the recommended action. A recommendation can include running an advisor, which you can do by clicking Run Advisor Now.
(Optional) Select one or more findings, and then click the action button above the table of findings. An example of an action button might be Schedule SQL Tuning Advisor.
By default Oracle Database runs ADDM every hour, immediately after an AWR snapshot. Performance findings from the most recent ADDM run, if any, are listed on the Database Home page. This is described in "Performance Self-Diagnostics: Automatic Database Diagnostic Monitor" .
You can also run ADDM manually. Reasons for doing so include running it as a recommended action associated with an alert or running it across multiple snapshots.
|
Note: If you need more frequent ADDM reporting, you can also modify the default snapshot interval. To do so, see "Modifying AWR Snapshot Frequency and Retention". |
The following steps describe how to run ADDM to analyze a period that spans multiple snapshots.
To run ADDM manually:
Go to the Database Home page.
Under Related Links at the bottom of the page, click Advisor Central.
The Advisor Central page appears.
Click ADDM.
The Run ADDM page appears.

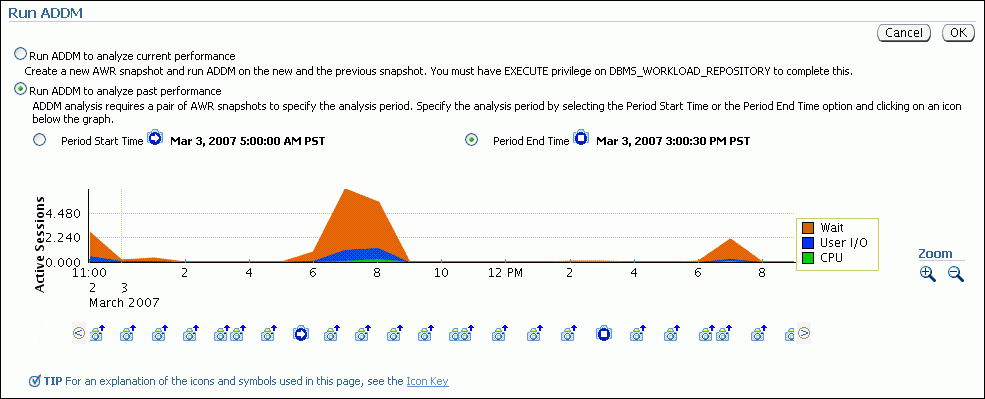
Select Run ADDM to analyze past performance.
Complete the following steps to choose a period start time:
Select the Period Start Time option.
(Optional) Examine the timeline graph and note the number of snapshots available in each 2-hour period. Each snapshot is represented by a camera icon. If your snapshots occur more frequently than once each hour and you want to view the timeline of snapshots with more precision, click the zoom-in icon at the right. (The zoom-in icon is a magnifying glass with a plus-sign.)
(Optional) Below the timeline graph, click the left-arrow icon or right-arrow icon at the left and right sides of the page to change the period shown in the timeline graph.
Click a camera icon.
A bold right arrow indicating period start time covers the camera icon, and the Period Start Time field above the timeline graph changes to the selected date and time.
If you want a period end time other than the default (the most recent snapshot), complete the following steps:
Above the timeline graph, select the Period End Time option.
(Optional) Click the left-arrow icon or right-arrow icon at the left and right sides of the page to change the period shown in the timeline graph.
Click a camera icon.
A bold square (like a stop button on a recording device) covers the camera icon, and the Period End Time field changes to the selected date and time.
Click OK to start the analysis.
After a short delay, the Automatic Database Diagnostic Monitor page appears, showing its findings.
(Optional) In the Task Name list, note the task name.
A typical task name is "Task_52." You can return to this analysis at a later time by searching for and selecting the task name in the Advisor Central page.
ADDM analysis is based on AWR snapshots, which have a default frequency of once each hour and a default retention period of 7 days.
Note:
The snapshot retention period does not apply to preserved snapshots, which are retained forever. A preserved snapshot set is typically created to define a reference period for performance analysis.You can view and alter these AWR snapshot settings.
To modify AWR snapshot frequency and retention:
Go to the Database Home page.
At the top of the page, click Server to display the Server page.
In the Statistics Management section, click Automatic Workload Repository.
The Automatic Workload Repository page appears.
Click Edit.
The Edit Settings page appears.
Enter new snapshot retention settings or new snapshot collections settings, and then click OK.