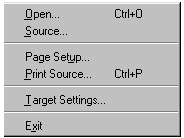
Source...
If using Source-Navigator with Insight, this menu item becomes Edit Source... for interoperability
The following functionality is for the right column.
Add lis to WatchOpens the Watch Expressions window and adds a variable expression (the lis variable shows in the examples) to the list of expressions in the window.Dump Memory at lisOpens the Memory window, which displays a memory dump at an expression (in the example program, the lis expression).
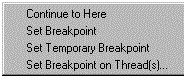
Figure 30: Pop-up menu for setting breakpoints
- A left click sets a breakpoint at the current line. The breakpoint appears as a red square in place of the minus sign.
- A left click on any existing or temporary breakpoint removes that breakpoint.
- A right click brings up a pop-up menu for setting breakpoints.
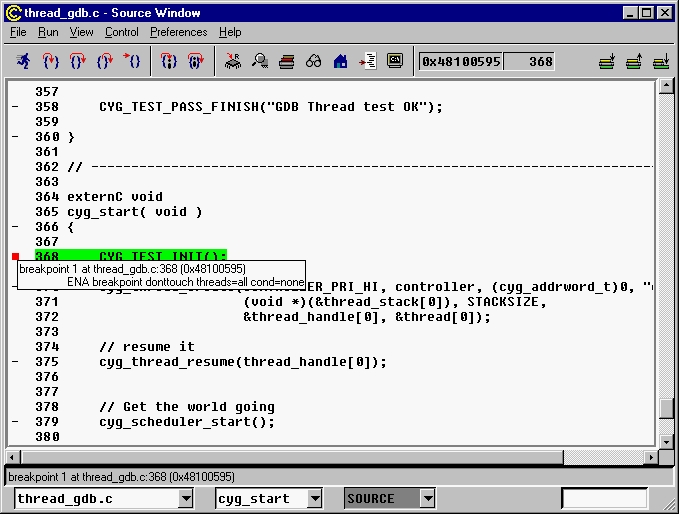
Figure 35: Function
drop-down combo box
The function drop-down list box displays all the
functions in the currently selected source or header file. Select a function
by clicking in the list box, or by typing into the text field above it.

Fewer Options
By default, pointers are displayed in hexadecimal and all other expressions are displayed as decimal.
Warning!
When debugging C++ code, breakpoints and exceptions may not work and, so, the functionality of the Breakpoints window may be inoperable.
Show if function
A drop-down list box (see Show
if function drop-down list box) contains the four alternatives
for matching the character string entered in the text edit field.
Figure 71: Show
if function drop-down list box

The alternatives for matching strings in the text edit
field have the following descriptions.
Hide .h files
View Source/Hide
Source

Warning!Threads support is not available for all systems.